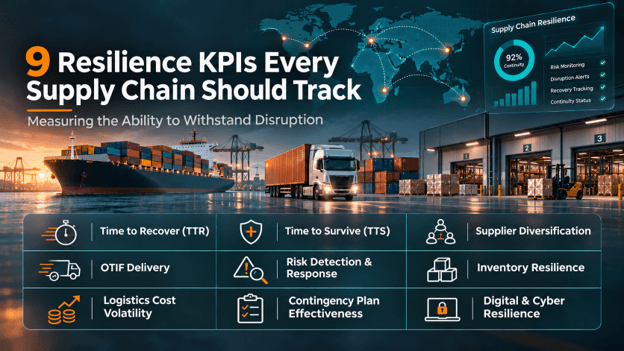
9 Resilience KPIs Every Supply Chain Should Track: Measuring the Ability to Withstand Disruption
Efficiency shows how your supply chain performs on a normal day. Resilience reveals what happens when disruption strikes. Explore nine essential KPIs to assess vulnerabilities, measure recovery and build a supply chain better prepared for uncertainty.
Editorial Desk
Nov 04, 2026
10 min read
A supply chain can appear efficient right up until the moment it is tested. One delayed shipment, one unavailable supplier or one blocked trade route can expose weaknesses that routine performance reports never reveal.
For years, businesses have measured supply chain performance through cost, delivery speed, inventory turnover and service levels. These indicators remain important, but they tell only part of the story. They show how a supply chain performs when conditions are relatively stable. They do not necessarily show whether it can withstand disruption.
That distinction matters more than ever. Geopolitical uncertainty, extreme weather, cyber incidents, changing trade requirements and transport constraints are placing pressure on global supply networks.
Research published by BSI in October 2026 found that 54% of surveyed organisations still manage supply chain risk primarily reactively. More concerning, 37% said they had not followed a pre-agreed crisis plan during a recent disruption.
The problem is not simply that disruption happens. It is that businesses can have risk policies, contingency documents and supplier agreements in place without knowing whether those arrangements will work under pressure.
Supply chain resilience must therefore be measured, tested and improved—not assumed.
The following nine KPIs can help businesses understand where their vulnerabilities lie and whether their operations are genuinely prepared for disruption.
How long would it take your supply chain to return to normal after a disruption?
Time to Recover measures the period required to restore an operation, supplier, facility or logistics route to an acceptable operating level following an incident.
Consider a manufacturer whose primary supplier suddenly stops delivering. If it takes three weeks to qualify an alternative source, the business may face production delays, missed orders and additional costs throughout that period.
A long recovery time can expose weaknesses in supplier alternatives, transport planning and operational flexibility.
What to measure
Recovery time by supplier, route and facility.
Time required to restore normal shipment volumes.
Delays between disruption identification and operational recovery.
The objective is to reduce recovery time for the parts of the supply chain that matter most.
2.Time to Survive (TTS)
How long can your business continue operating if a critical supply source becomes unavailable?
Time to Survive measures how long operations can continue using available inventory, alternative supply and existing resources before disruption affects production or customer commitments.
For example, a business holding five days of critical component stock has a limited window to secure replacement supply if its main supplier becomes unavailable.
This KPI helps determine whether inventory buffers are sufficient to protect essential operations.
What to measure
Days of available inventory for critical materials.
Alternative supplier lead times.
Operational buffer before production or service is affected.
A business should understand its survival window before a disruption begins—not calculate it after operations have stopped.
3.Supplier Concentration and Diversification
How much of your business depends on one supplier, region or transport corridor?
A supply chain may have several suppliers but still carry significant concentration risk. If those suppliers operate in the same geographical area or rely on the same shipping route, one regional disruption could affect them all.
The CIPS Q2 2026 Pulse Survey, published in July 2026, identified supplier diversification as the highest-ranked strategy for maintaining continuity over the following three to six months.
This reflects a wider shift: businesses are looking beyond supplier prices and assessing the consequences of relying too heavily on a limited number of sources.
What to measure
Percentage of spend concentrated among major suppliers.
Geographic concentration of sourcing.
Availability of qualified alternative suppliers.
Dependence on individual ports, routes or transport providers.
Diversification does not mean replacing every supplier. It means knowing where a single point of failure could put the business at risk.
4.On-Time In-Full (OTIF) Delivery
Are customers receiving the right products, in the right quantities, at the agreed time?
OTIF measures the percentage of orders delivered on time and in full. It is a familiar supply chain performance indicator, but it also provides an important view of operational resilience.
A sudden decline in OTIF may indicate problems with supplier reliability, transport capacity, customs processes or inventory availability.
For international shipments, delays can occur at several points between collection and final delivery. Monitoring OTIF alongside the reasons for missed commitments helps businesses identify recurring weaknesses rather than treating every late delivery as an isolated incident.
What to measure
Percentage of orders delivered on time and in full.
OTIF performance by supplier, route and customer.
Frequency and causes of delivery failures.
5.Risk Detection and Response Time
How quickly can your business identify a threat—and how quickly can it act?
A disruption detected early may be manageable. The same problem, discovered after a shipment misses its delivery window or a production line stops, can become significantly more expensive.
The BSI 2026 research found that only 27% of surveyed organisations could take action on the same day when disruption struck. It also highlighted gaps in supplier-location visibility and cross-functional information sharing.
This makes early warning systems, shipment tracking and clear escalation procedures essential.
What to measure
Time between identifying a risk and escalating it.
Time taken to approve corrective action.
Availability of accurate supplier and shipment information.
Frequency of delayed responses caused by missing data.
Visibility has little value if the information arrives too late to influence a decision.
6.Inventory Resilience and Stockout Rate
Is your inventory protecting the business—or leaving it exposed?
Holding more stock is not automatically the answer. Excess inventory can tie up working capital, increase warehousing costs and create obsolescence. However, insufficient stock of critical materials can leave a business vulnerable when replenishment is delayed.
The challenge is to identify which products require additional protection and which can operate with leaner inventory levels.
BSI's October 2026 research found that 80% of surveyed organisations planned to increase strategic inventory stockpiles over the following six months. This signals growing attention to inventory as a resilience measure, although stock decisions still need to reflect the cost and criticality of individual products.
What to measure
Stockout frequency and duration.
Days of inventory cover for critical products.
Replenishment lead-time variability.
Availability of alternative stock locations.
The right inventory strategy balances continuity with cost—not simply the amount of stock held.
7.Logistics Cost Volatility
What happens to your logistics budget when the planned route or transport option is no longer available?
A contracted freight rate may look competitive under normal conditions. But when capacity tightens, routes change or urgent alternatives become necessary, the actual cost of moving goods can increase considerably.
The CIPS Q2 2026 survey found that 35% of respondents expected shipping and logistics input prices to rise by more than 10%.
This makes it important to monitor not just freight rates, but also the additional costs associated with disruption.
What to measure
Difference between planned and actual freight expenditure.
Emergency transport and rerouting costs.
Additional storage, handling and demurrage charges.
Cost impact of delayed or disrupted shipments.
For a broader view of logistics expenditure, businesses should also consider the costs beyond the freight quotation. Clarusto's guide to the true cost of warehousing explores why storage costs involve more than the headline rental rate. Our landed cost guide also helps importers understand the full cost of moving goods internationally.
8.Contingency Plan Effectiveness
Does your contingency plan work in practice—or does it only exist in a document?
A business may have alternative suppliers, emergency transport arrangements and escalation procedures. But if employees do not know who makes decisions, approvals take too long or alternatives have never been tested, the plan may fail when it matters most.
The BSI findings are a reminder that having a plan is not the same as being ready to execute it. The fact that 37% of surveyed organisations did not follow a pre-agreed crisis plan during a recent disruption points to a gap between preparation and action.
What to measure
Time required to activate a contingency plan.
Results of scenario tests and operational simulations.
Readiness of alternative suppliers and transport arrangements.
Time taken to approve and implement corrective action.
Plans should be tested against realistic scenarios, including supplier failure, route disruption, customs delays and technology outages.
9.Digital and Cyber Resilience
Can your supply chain continue operating if the systems supporting it become unavailable?
Modern logistics relies on connected systems for shipment visibility, inventory management, customs documentation, transport coordination and communication.
A cyber incident or technology failure can therefore affect physical operations as well as digital processes. Businesses need to understand whether critical information can be accessed, recovered and communicated when normal systems are unavailable.
The Institute for Supply Management and Amazon Business 2026 research found that 65% of surveyed supply chain professionals still relied on manual reporting to gather supply chain data. The finding highlights how limited information flows can affect visibility and decision-making.
What to measure
Recovery time for critical logistics and operational systems.
Availability and reliability of shipment data.
Cybersecurity incident frequency.
Backup and data recovery readiness.
Ability to maintain essential operations during system outages.
Digital resilience should be treated as part of supply chain continuity—not as an IT issue in isolation.
Turning Resilience KPIs into Better Decisions
Tracking nine indicators is useful only when the results influence business decisions.
Start by identifying the suppliers, products, routes and facilities that are most critical to operations. Establish a baseline for each relevant KPI, assign responsibility for monitoring it and agree on what action should follow when performance deteriorates.
The indicators should also be considered together. High supplier concentration may increase the need for inventory buffers. A long recovery time may expose weaknesses in contingency planning. Rising emergency freight expenditure may indicate that risks are being identified too late.
Research from APL Logistics' European Supply Chain Survey 2026 illustrates why measurement matters. Although 90% of the 100 European supply chain leaders surveyed reported having a formal risk strategy, only 8% rated their mitigation efforts as highly effective. The survey covered senior leaders in the UK, France, Germany and the Netherlands.
The message is clear: having a resilience strategy is not enough. Businesses need to know whether it is delivering practical results.
For companies moving goods internationally, resilience also depends on the coordination of freight forwarding, customs clearance, transport planning and warehousing. Reviewing these activities together can help identify operational dependencies before they become costly problems.
Explore Clarusto Logistics' supply chain management services to see how coordinated logistics support can help businesses manage the practical demands of moving cargo across supply chains.
The Real Measure of Resilience Is What Happens Next
No supply chain can eliminate every disruption. Geopolitical uncertainty, extreme weather, supplier failures, cyber incidents and transport constraints will continue to challenge global trade.
But businesses can become better prepared.
The real question is not whether disruption will happen. It is whether your supply chain can absorb the impact, maintain critical operations and recover without losing control of cost, service and customer confidence.
A resilient supply chain is not one that never fails. It is one that knows how to respond when it does.
Looking to strengthen logistics continuity across freight, customs and warehousing? Talk to Clarusto Logistics about building a more connected supply chain.
Supply chain resilience KPIs are measurable indicators used to assess how well a business can anticipate, withstand, respond to and recover from disruption.
Which supply chain resilience KPI is most important?
Time to Recover and Time to Survive are useful starting points because they reveal how long operations can withstand disruption and how quickly they can return to an acceptable operating level. The most relevant KPI depends on the business's critical risks.
How often should supply chain resilience be measured?
Critical operational indicators should generally be reviewed monthly. Supplier dependencies, risk exposure and contingency plans should also be reassessed when operating conditions or trading routes change.
How can logistics providers support supply chain resilience?
Logistics providers can help businesses coordinate freight movements, manage customs requirements, assess transport alternatives and improve shipment visibility, supporting more reliable supply chain operations.